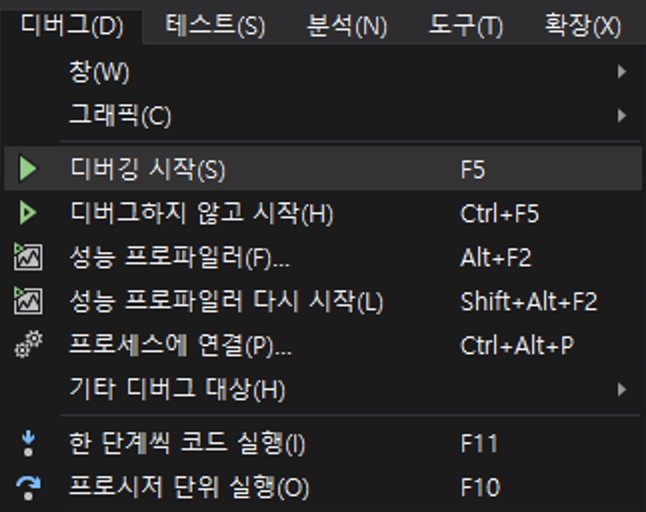
This section explains how to debug WSH(Windows Script Host) operating stand-alone on the desktop.
The way of old-school
It could be used as a Just-In-Time Debugger of csript.exe or wscript.exe in an environment where Windows Script Debugger or Microsoft Visual InterDev is installed.
wscript.exe /d [path to WSH file]-> JIT operationwscript.exe /d /x [path to WSH file]-> Run with Debugger
Windows Script Debugger
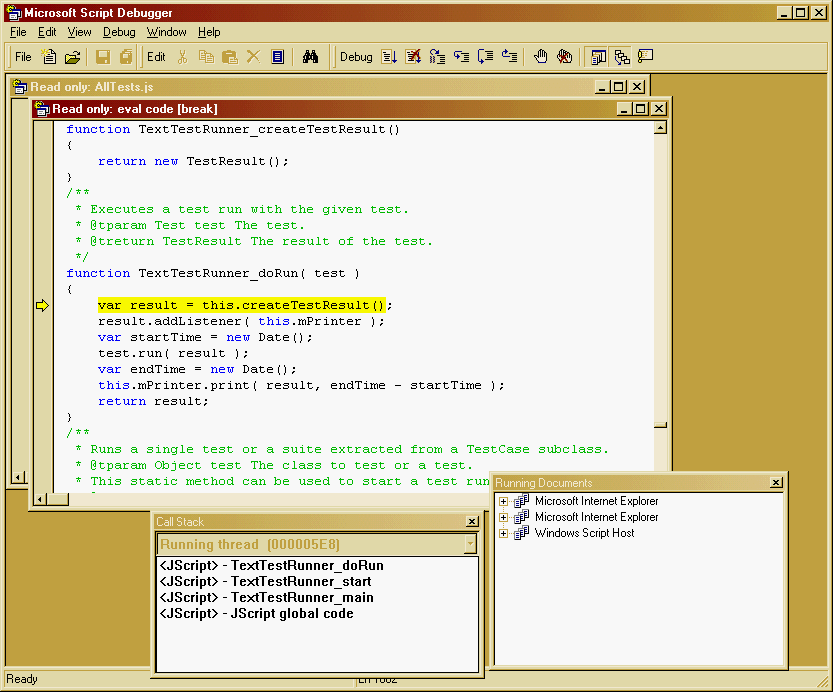
- Included as an optional tool up to MS Office 2007
- Improved debugger included in IE8 Developer Tools
Microsoft InterDev
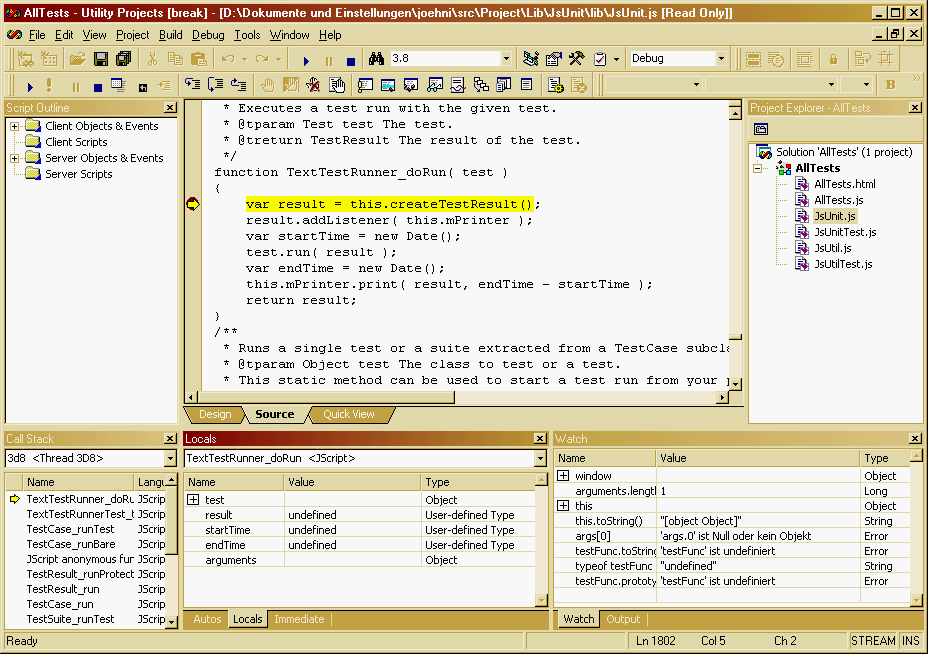
- IDE for web application (ASP) development
- Included in VS 97, 6.0
I obtained and ran the two softwares for debugging, but they did not run normally in the latest Windows Environment(20H2(OS Build 19042.1526).
The modern way
Visual Studio JIT Debugging
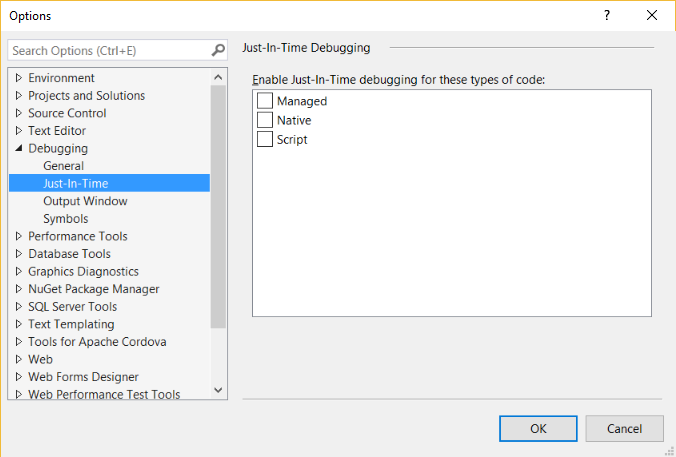
You can set the JIT for your script in Visual Studio. However, this method enables debugging when an exception occurs, and from the point of view of a malicious code analyst, it is necessary to load it using a debugger to analyze it from the entry point.
The EXE Project
In Visual Studio, an externally created application can be debugged using EXE Project. Create a project with cscript.exe or wscript.exe in the %windir%/system32 path with Visual Studio.
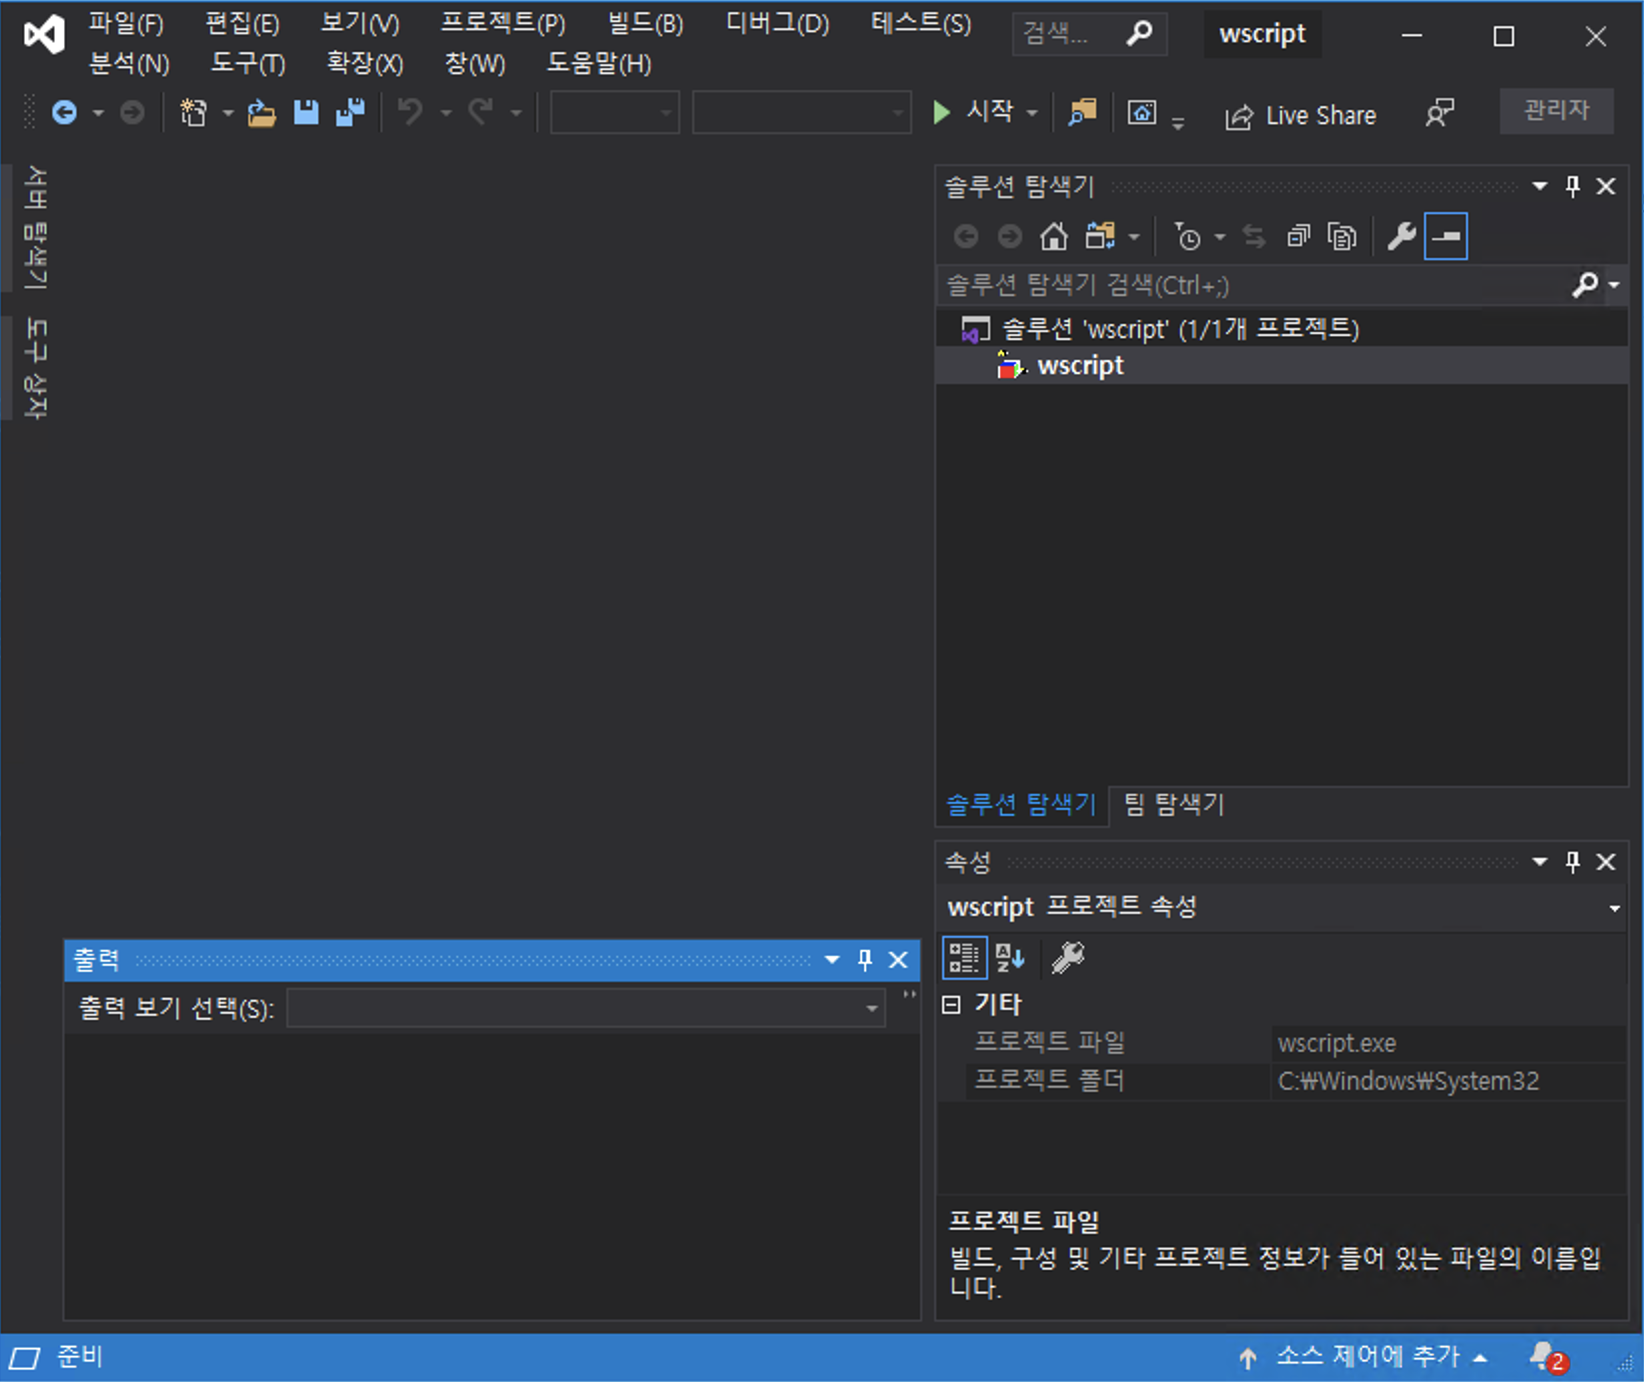
When a project is created, properties are configured for the debugging environment.
 Sorry for the Korean image
- Debugger format: script
- Arguments: /d [Target WSH file name]
- Working directory: [Target WSH file working directory]
Start debugging with the configured environment.
- F10 or F5
